Building a box to monitor the temperature and pressure of a vacuum chamber was a fun mix of problem-solving and hands-on work. Making sure everything worked together came with challenges and surprises, but looking back, it’s a rewarding example of tackling a technical project step by step.
ToC
1. Introduction
2.1. Components
2.2. Wiring Diagram
2.3. Relevant Data Sheets and Manuals
2.4. Setting up the Arduino Mega 2560
2.4.1. MAX3185 Thermocouple Libraries
2.4.2. MAX 3232 and Communicating with the MKS 901P Sensor
2.4.3. 2004A LCD Display
2.4.3.1. Troubleshooting Issues with the 2004A LCD Display
2.4.4. Arduino Sketch
3. Installation and Usage
3.1. Python Script
3.2. Setting Up Environment
3.3. Usage
3.4. Common Issues and Troubleshooting
3.5. Configuration
1. Introduction
Creating the vacuum chamber monitor was my first project for the University of Hawaii High Energy Physics Group. I had worked on several Arduino projects in the past but most did not have any practical use. I learned how to make my own wires and connectors and communicating with sensors via SPI and RS-232.
2. Manufacturing
2.1 Components
- Arduino Mega 2560
- 2004A LCD
- MAX 3232
- MKS 901P Sensor
- 4-Channel T-Type Thermocouple Sensor MAX31855 SPI Arduino Shield
- Ch. 0-3
- Ch. 4-7
- 8 x T-Type Thermocouple Wire
- 8 x Mini T-Type Thermocouple Wire Connector Male Plugs
- 8 x Mini T-Type Thermocouple Wire Connector Female Plugs
- 9 to 24 V DC Power Source
- 6-20 V DC Power Source
- 1 USB-A/USB-C to USB-B Cable
- VGA Cable (for RS232 communication between pressure sensor and Arduino)
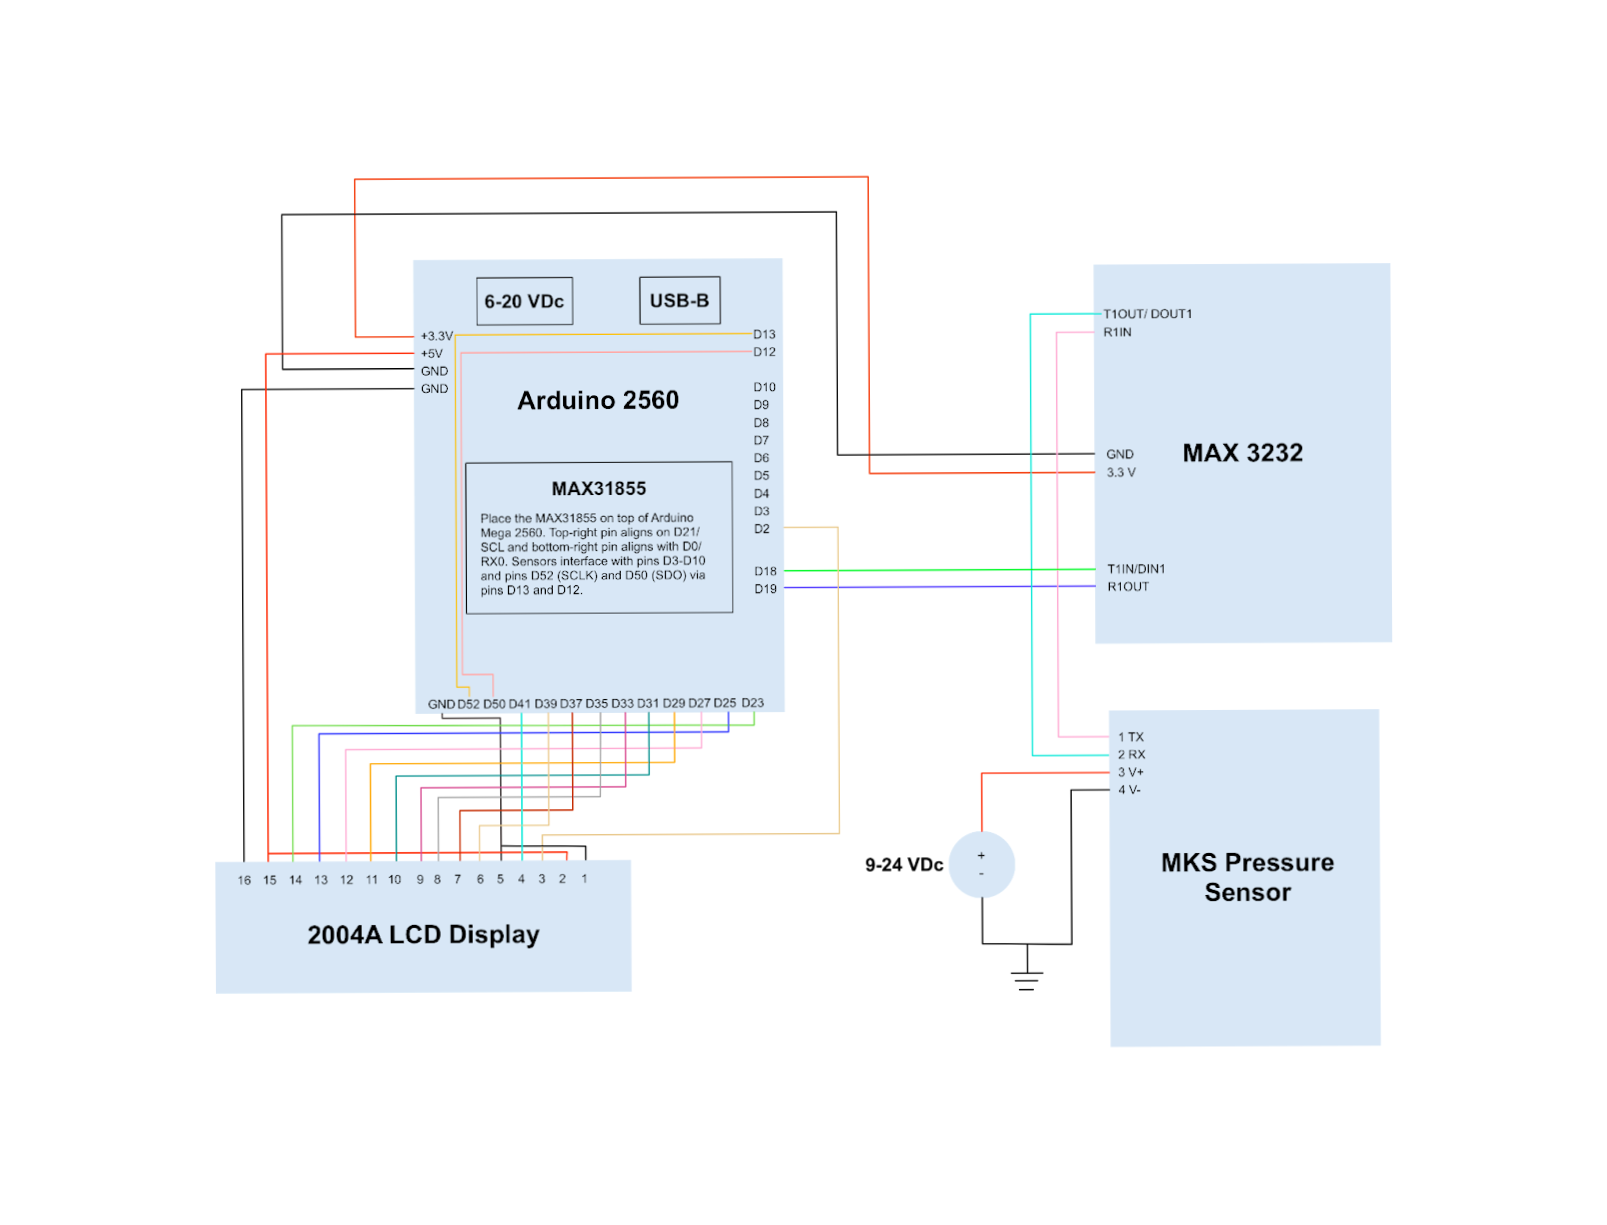
2.2 Wiring Diagram
2.3 Relevant Data Sheets and Manuals
Arduino Mega 2560:
https://content.arduino.cc/assets/Pinout-Mega2560rev3_latest.pdf
2004A LCD:
https://uk.beta-layout.com/download/rk/RK-10290_410.pdf
MAX 3232:
MKS 901P Pressure Sensor:
https://www.mks.com/mam/celum/celum_assets/resources/HPS901man-REVI.pdf
4-Channel T-Type Thermocouple Sensor MAX31855 SPI Arduino Shield:
https://www.playingwithfusion.com/include/getfile.php?fileid=7005
2.4 Setting up the Arduino Mega 2560
The Arduino Mega 2560 uses the following libraries:
- SPI.h
- LiquidCrystal.h
- PlayingWithFusion_MAX31855_Wcorr.h
- PlayingWithFusion_MAX31855_STRUCT_corr.h
2.4.1 MAX3185 Thermocouple Libraries
SPI.h and LiquidCrystal.h are typically pre-installed. If they are, however, uninstalled, you can search for and install them within the Arduino IDE’s library manager. The last two libraries are necessary to interact with the thermocouples but will not appear when searching through the Arduino IDE’s library manager. They will need to be manually imported. You can import the necessary libraries into the Arduino IDE by doing the following:
- Download the code as a zip file provided by Playing With Fusion as a ZIP file at https://github.com/PlayingWithFusion/PWFusion_MAX31855_Tcorrection.
- Open the Arduino IDE. Click on Sketch > Include Library > Add .ZIP Library and import the ZIP file. Alternatively, you can extract the contents of the ZIP file and copy its contents into another folder located within the Arduino computer on your computer.
Note: The example in the library by PlayingWithFusion assumes that the shield is connected to an Arduino Uno and data is being communicated to a separate Arduino board. The example code assigns pins 13 and 12 as the SCLK AND SDO pins but this does not apply to Arduino Mega boards. Wires are used to attach pins 13 and 12 to pins 52 and 50, which are the SCLK and SDO pins on the Arduino Mega 2560.
2.4.2. MAX 3232 and Communicating with the MKS 901P Sensor
The Arduino Mega 2560 communicates with the MKS 901P sensor via the RS232 protocol. Because the Arduino Mega 2560’s pins can only read input voltages from 0 V to 5 V and valid RS232 signals range from 3V to 15 V or -3 V to -15 V, the MAX 3232 is needed to be the intermediary of communication between the two devices.
Note: The MAX 3232 board labels the header pins used for RS232 communication and the header pins that are connected to the Arduino. The RS232 device will be connected to the header pins in the region labeled RS232 and the Arduino will be connected to the header pins in the region labeled Digital. RIN1 corresponds to the TX line of the RS232 device while DOUT1 corresponds to the RX line of the RS232 device.

2.4.3. 2004A LCD
The 2004A LCD is connected to the Arduino via all of its 16 pins with pins 7 to 14 as the data pins. The Arduino Mega 2560 originally used only four of the eight data pins but was transitioned to use all eight data pins after issues with the display showing garbage output after prolonged periods of changing LCD output. This problem is caused by the pins having to remain in nibble sync when using only four out of the eight data pins. Discussion on this topic can be referenced at the following post on Arduino forums: https://forum.arduino.cc/t/lcd-display-16x2-showing-gibberish-how-to-reset-solved/686104/2. While using all eight data pins is not required, it is strongly recommended to avoid unexpected output from being displayed.
The backlight is powered separately from the LCD through pins 15 (A+) and 16 (K-). Contrast can be adjusted by wiring pin 3 on the LCD to an analog pin on the Arduino Mega 2560 (i.e. pin 2 in the provided schematic).
2.4.3.1. Troubleshooting Issues with the 2004A LCD Display
If you experience further problems with the display showing no output or providing garbage output, you should try the following:
- Confirm that the wires are firmly soldered to the LCD’s pins and the jumper pins connecting the display to the Arduino are firmly soldered to its wire. The majority of issues with malformed display output after using an eight-wire data interface with the display were because jumper pins became slightly disconnected from their wires over time due to insufficient solder being used. Tug on the wires while the jumper pins are connected to the Arduino and re-solder the wires to the jumper pins if necessary.
- Confirm that the power wires for the LCD and its backlight are connected to a 5 V source. If the power wires are connected to the header pins on the Arduino board located closest to its DC barrel jack, it is possible that the wires may be placed into the 3.3 V header instead. This will lead to the LCD showing no output (although the backlight may be on).
Note: The 2004A LCD used in this project did not include an I2C backpack. The number of wires can be reduced if using an LCD with support for I2C (either through an I2C backpack or jumper pin).
2.4.4. Arduino Sketch
The code running on the analyzer’s Arduino Mega 2560 can be downloaded at the following link:
https://drive.google.com/drive/folders/1FvHywqroQM58hFyKF-RLn7G3XHBQXb2j?usp=sharing.
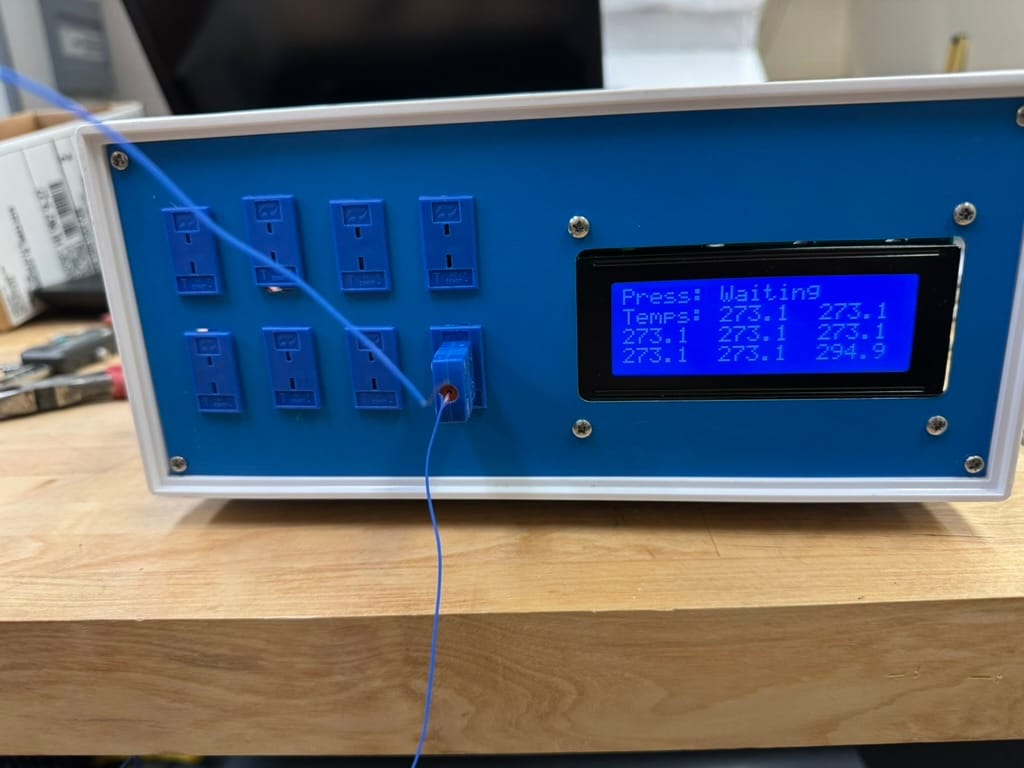
Open the analyzer.ino file in the Arduino IDE and connect your device to the USB-B port of the Arduino Mega 2560. Compile and upload the code to the Arduino Mega 2560. The display will take a second to initialize. After initializing, the display will show a pressure reading in torr along with eight temperature readings in Kelvin.

Check the Serial Monitor and confirm that 9 values are being printed in the console. If the MKS pressure sensor is not attached to the analyzer, you will see “Waiting” in the Serial Monitor and on the display to indicate the status of the pressure sensor.
3. Installation and Usage
3.1. Python Script
The Python script used to interface with the analyzer can be also downloaded at the following link: https://drive.google.com/drive/folders/1FvHywqroQM58hFyKF-RLn7G3XHBQXb2j?usp=sharing.
3.2. Setting Up Environment
The following packages must be installed to interface with the analyzer and view its visualizations on a computer:
- pyserial
- pandas
- dash
- Plotly
Conda
If you use conda to manage environments, you can create a new environment from the environments.yaml file included in the program files using the following command in the command line:
Pip
If you prefer to use pip, you can install each packages separately using the following command:
Alternatively, you can use pip with the requirements.txt file (which was generated with conda) as follows:
A virtual Python environment is recommended to prevent any conflicts with existing or future Python packages in your global Python environment. Instructions for creating a virtual environment can be referenced in Python documentation: https://docs.python.org/3/tutorial/venv.html.
3.3. Usage
Run the analyzer_interface.py script while the Arduino is connected to your computer. You can use the IDE of your choice or use the following command while in the same directory as analyzer_interface.py script:
You will be prompted to select the serial port that the Arduino is connected to. For Windows computers, this will typically be “COM3”. For Mac and Linux computers, this will be a port resembling "/dev/cu.usbmodem12101". If you are unsure which port you should connect to, you can open the Arduino IDE and click on Tools > Port to see which port corresponds to the Arduino.

Prompt for selecting ports on a Windows computer. For Mac and Linux computers, this will be a port resembling "/dev/cu.usbmodem12101". You may also see a port related to Bluetooth.
After selecting the correct port, a message indicating that Dash has started a local server and the address to access the interactive visualizations of the pressure and temperature data will appear. The address will typically be “http://127.0.0.1:8050/”. Enter that address in a web browser to launch the dashboard for viewing visualizations of temperature and pressure data. It will take a few seconds for the data to populate and display a visualization. If you are experiencing errors with the web server, please make sure that port 8050 is not in use or modify the script to use another port.

The interactive graphs for temperature and pressure readings. You can hover over a data point to read its exact value and have the option to save the plot as a PNG file by clicking on the camera icon in the top-right corner.
The script will save the pressure and temperature data to a CSV file located in the same directory with its title having the format “YYYY-MM-DD_HH-MM-SS.csv”. The script will populate the CSV file with data as measurements are taken by the analyzer.
3.4. Common Issues and Troubleshooting
Callback error updating live-graph.figure
- Turn off sleep-related settings on your computer. If the computer goes to sleep while connected to the Arduino, there may be an interruption in reading the data and the local server will not be able to update the graph.
- Keep only one instance of the dashboard open in your browser. The Python script uses separate threads for reading serial data and the local server to display visualizations for temperature and pressure. Threading is necessary to run both of these processes simultaneously. Python’s implementation of threading, however, does not support parallel threads because of the Global Interpreter Lock and allows only one thread to run at a time in a process. This can create issues when there are multiple attempts at the same time by one thread to read data from another thread.
3.5. Configuration
baudrate
The baudrate determines the speed of data transmission in a communication channel and represents the number of signal changes per second. Devices using serial communication must use the same baudrate for messages to synchronize signal changes and interpret each other’s messages. By default, the Arduino Mega 2560 and the Python script are configured to 9600 baud.
timeout
The number of seconds that the program will wait before terminating serial communication. By default, the Python script is configured to wait 5 seconds.
window_size
The size of the window used to calculate the rolling average of the temperature and pressure. By default, the Python script uses a window size of 5.
active_thermocouples
This is an array of strings specifying the thermocouples that are active and should be displayed on the dashboard.
4. Conclusion
Working on the vacuum chamber monitor was my first experience creating a project with practical applications, and it was both challenging and rewarding. I gained valuable hands-on skills, such as interfacing with sensors using SPI and RS-232, troubleshooting hardware connections, and managing data visualization with Python. These tasks taught me how to integrate hardware and software into a cohesive system and adapt when unexpected issues arose.
This project also emphasized the importance of clear documentation and planning. Writing detailed instructions, creating wiring diagrams, and optimizing workflows not only improved usability but also prepared me for future collaborative projects. The challenges I encountered reinforced the value of persistence, iterative design, and testing. Overall, this experience has strengthened my technical skills and problem-solving abilities